The Incentive
Today’s content delivery networks (CDNs) are doing much more than just caching and bit pushing. All the major players are trying to extend their business into the territory of edge computing. Advanced platforms, such as CDNetworks’ CDN Pro, offer programmability to support sophisticated logic on the edge servers. Some logic, such as cryptographic algorithms, regex manipulations, and data compression, can be extremely computationally intensive. Running them on the CDN edge not only offloads these resource-intensive activities from the origin, but also reduces latency significantly to provide end-users with a satisfying experience.
However, this trend is not always reflected in industry price models. Most CDN providers continue to charge primarily based on traffic volume (bytes delivered) or bandwidth (mostly 95p). This model was created decades ago, when the majority of CDN costs were based on the bandwidth procured from ISPs. This model worked well when a CDN was used only to deliver Highly Cacheable Large Files (HCLF); however, this is no longer the case today. For example, a modern server can easily deliver 40Gbps of HCLF; however, to accelerate a dynamic API service of the same bandwidth across the Pacific Ocean, 500 servers may be required. The data center cost is largely proportional to the number of servers. This huge disparity in resource consumption by different services creates many pricing challenges for both the CDN providers and their customers.
To ensure profitability, CDN providers must merge all extra costs into a per-GB or per-Mbps price. But before a service is completely on board, it’s not feasible to accurately estimate the additional cost it will generate. Customers can usually provide a ballpark number for traffic volume or bandwidth, but they can’t tell how many servers will be needed. Not to mention that they may change their business logic at any time through a self-service interface. It takes a lot of guesswork to set the price based on the traditional model. As a result, it is nearly impossible to create a price book that is fair for all customers and service types. The solution is quite simple: introduce a charge for CPU consumption. CPU has been a billing item of cloud computing since the cloud’s inception. Therefore, it should be no surprise to see it adopted by edge computing, which is what CDN is evolving into.
How does it work?
Since the resources of a CDN platform are shared across multiple customers, it is not easy to measure usage by each individual customer. Even for traffic volume, the most commonly used billing item, only data from the application layer can be accounted for accurately. It is quite tricky to collect the network overhead at lower layers and attribute it to each customer, so most providers decide not to bother with this. Measuring the CPU utilization of each customer can be even more challenging. However, we identified this as a must-have feature at the beginning of the CDN Pro project back in 2016. When we decided to build an edge server based on NGINX, our team made extensive changes to the open-source version of NGINX.
NGINX has an “event-driven, non-blocking” architecture. Every request is “put to sleep” when waiting for I/O, awakened when some data is ready to be processed, and then put to sleep again when the processing is completed. This can occur many times during the lifecycle of a request. We use the function clock_gettime() on Linux to obtain the amount of CPU time, in nanoseconds, spent on each active interval of each request and accumulated along the way. At the end of the request’s lifecycle, we write the total CPU time consumed into the access log, the same way we treat the number of bytes transferred. The CPU time is included in the traffic summary log to generate low-latency, per-domain reports.
While this method can accurately measure the CPU time consumed by the NGINX processes on each request, it does not include the following:
● Kernel processing the interrupts from the network interface cards or other I/O devices.
● Common tasks performed by the NGINX main process.
● Other services running on the same server, such as log preprocessing and monitoring.
The Data
As mentioned above, the CDN Pro platform offers a time series report to show the CPU time consumed by each domain. It returns this metric, in seconds, for each time interval of the specified granularity. For more information, refer to the API documentation. This report is similar to the traffic volume report, which returns the number of bytes delivered in each interval; in this case, we divide the values by the width of the interval to determine traffic bandwidth. For the CPU report, the division results in the number of CPU cores consumed in each interval. Another interesting metric is the average CPU time per request. This value varies between a few microseconds and a few seconds across different domains served by CDN Pro. The following are a few of the main factors that affect this value:
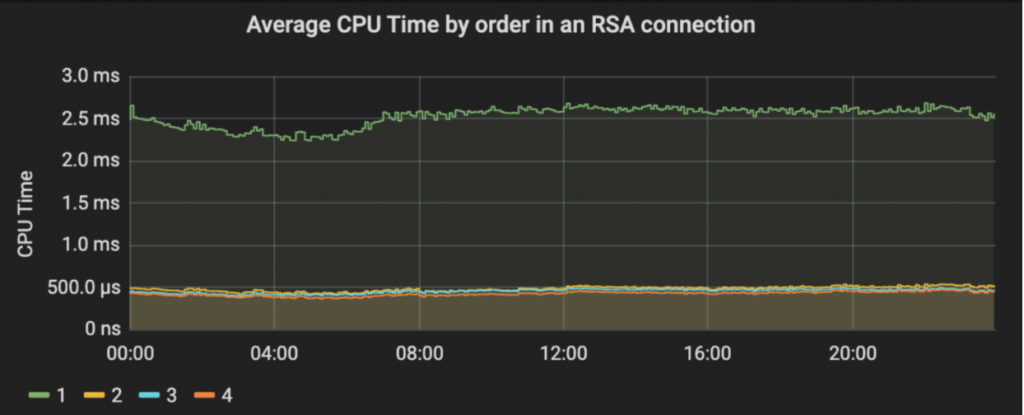
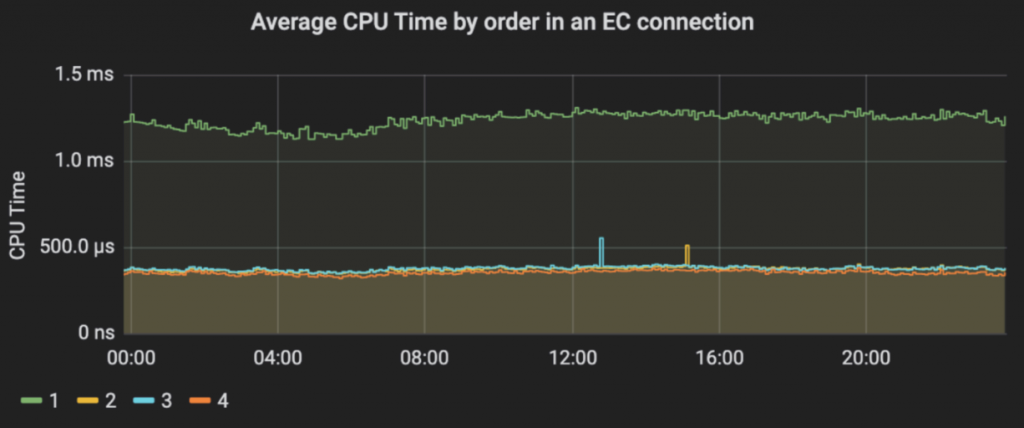
TLS handshake: The following charts show the average CPU time per request grouped by the order in the connection. The curves with the label “1” correspond to the first request in each connection. The difference between it and the subsequent requests “2”, “3”, and “4” reflect the CPU time consumed by the TLS handshake. We can see that about 2.0ms are consumed on average by an RSA connection with an RSA-2048 certificate. In contrast, an EC connection with an ECDSA-256 certificate uses roughly 0.9ms.
TLS reuse factor: If a TLS connection is reused by multiple requests, the cost of the handshake is shared by all those requests.
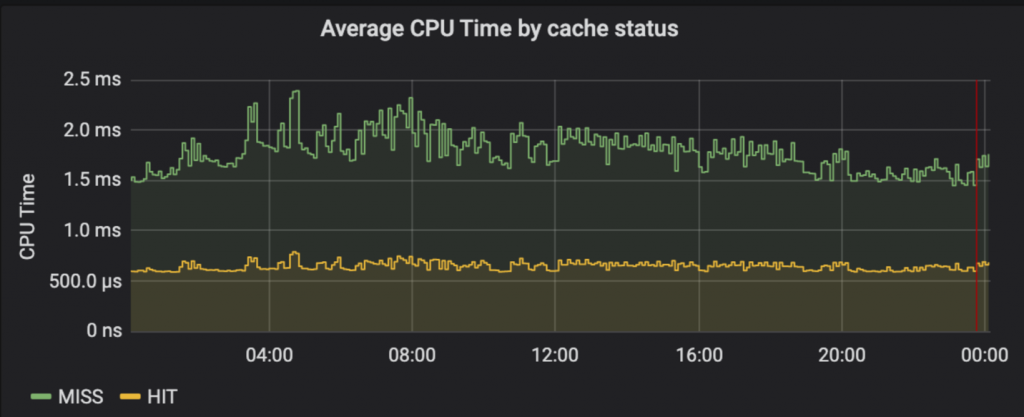
Cache hit status: A hit usually takes less CPU time, as shown in the following chart:
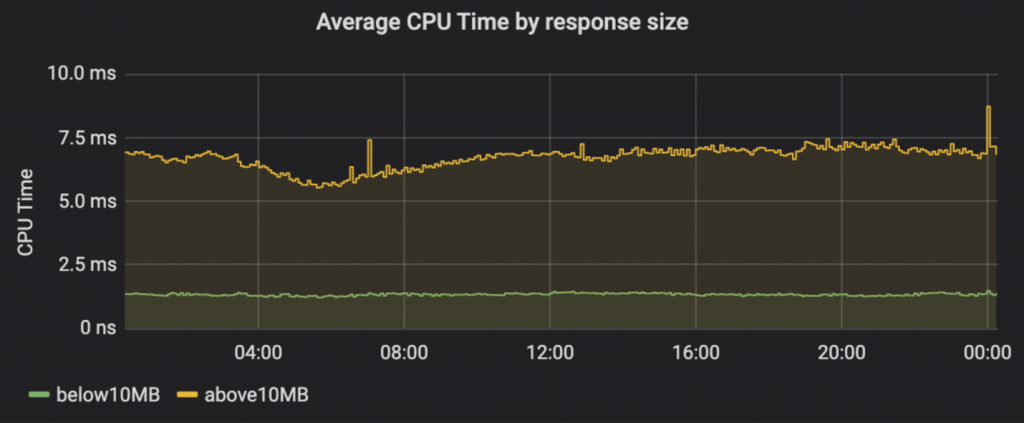
Size of the response: Larger responses take more CPU power to deliver:
To determine the amount of CPU resources needed to deliver a fixed amount of data, divide the CPU time by the traffic volume. There are significant differences among different domains. As shown in the table below, domains with HCLF can require less than 1 second per GB, but highly dynamic API services can require hundreds of times more CPU.
Below are recent statistics from CDN Pro customer domains with gigabytes of traffic. The CPU time column indicates the CPU time required to handle each GB of data.
(The domain names are hidden for privacy.)
| Domain | Content Type | CPU Time to Deliver 1GB |
| Domain1 | Dynamic API Service | 453.66 s |
| Domain2 | Dynamic API Service | 315.72 s |
| Domain3 | Dynamic API Service | 66.06 s |
| Domain4 | Dynamic API Service | 65.78 s |
| Domain5 | Dynamic API Service | 29.84 s |
| Domain6 | Dynamic API Service | 25.19 s |
| Domain7 | Dynamic API Service | 18.81 s |
| Domain8 | HCLF | 7.20 s |
| Domain9 | HCLF | 2.60 s |
| Domain10 | HCLF | 2.12 s |
| Domain11 | HCLF | 1.75 s |
| Domain12 | HCLF | 1.56 s |
| Domain13 | HCLF | 801.98 ms |
Billing
The data above clearly illustrates the point made in the first section. It is not fair to base CDN service charges solely on network traffic. This approach is akin to charging everything in a supermarket based only on weight. Introducing billing by CPU time ensures each customer is charged equitably for resources they use. CDNetworks website has officially introduced this new approach to billing. As a result, the charge for HTTPS requests will be removed because the associated cost will be more accurately covered. At the same time, the traffic volume prices for all server groups will be reduced significantly. Please stay tuned!

